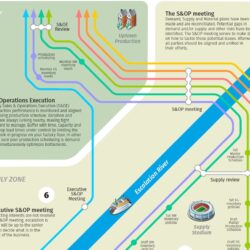
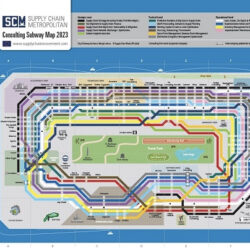
S&OP Subway Map: A journey from strategy to schedule
Sales & Operations Planning and the more extensive Integrated Business Planning are both decision-making processes that aim to proactively balance demand and supply. But how does an S&OP process actually work? Especially in large organizations, it can be quite challenging to appreciate the big picture and see the dependencies we need to be aware of. That’s why Supply Chain Movement and Involvation have created a subway map to visualize how an S&OP can look.
Every company’s Sales & Operations Planning/Integrated Business Planning journey is unique. It must fit the needs of the business and the structure of the organization. In addition, an S&OP process should be revised regularly in order to adapt to any kind of change affecting it. And of course it’s also subject to continuous improvement. All in all, there are countless S&OP/IBP journeys in existence.
This subway map portrays the S&OP journey of a fictional organization operating in a Make-to-Stock environment with a rapidly changing portfolio. In this example we depicted a classic S&OP process at around maturity level 3. A next improvement for this fictional organization would be to integrate financial planning into its journey, making it a real IBP process.
Download the full S&OP Subway Map
Fill in the form below and receive the S&OP Subway Map in your mailbox.
To read this subway map, start at the top left and follow the process to the top right corner.
Find all Subway Maps of Supply Chain Movement >>
Download: S&OP Subway Map
Related posts:
-
Consulting Subway Map 2023: Thriving in a VUCA world
Just as in 2021, most European consulting firms did very well last year, with over 80% generating more profit in…
-
Supply Chain Movement Q1 2012 – S&OP Special
Contents 3 | Column: Holy Grail of ERP and S&OP 7 | News & Background: Recruit the ‘yes’ gene…
-

Successful managers understand their role in an S&OP meeting
The virtual game The Fresh Connection, a new round of which is about to start in several countries, demonstrates strong…
-

Supply Chain Movement issue 33 – From S&OP to IBP
Contents Supply Chain Movement 33 – 2019 Q2 Date of appearance: May 10th, 2019 6 | News & background The…