S&OE Subway Map: A journey from plan to transaction
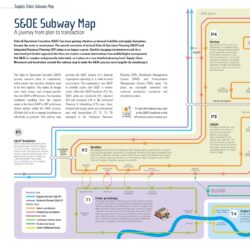
Sales & Operations Execution (S&OE) has been gaining attention as demand volatility and supply disruptions became the norm in recent years. The smooth execution of tactical Sales & Operation Planning (S&OP) and Integrated Business Planning (IBP) plans is no longer a given. Quickly changing circumstances ask for a structured yet flexible approach that does not require constant interventions from middle/higher management. But S&OE is complex and generally underrated, as it plays on a very detailed planning level. Supply Chain Movement and Involvation created this subway map to make the S&OE process more tangible by visualizing it.
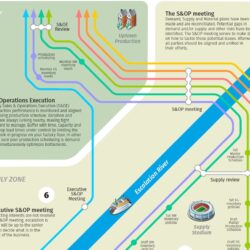
The Sales & Operations Execution (S&OE) process connects plans to transactions, which means that countless elements need to be tied together. This makes its design even more unique and company-specific than the S&OP or IBP process. The boundary conditions resulting from the choices made in the latest S&OP or IBP cycle leave limited options within the S&OE process. All that’s left to do is manage deviations as effectively as possible. This subway map portrays the S&OE journey of a fictional organization operating in a make-to-stock environment. The organization runs S&OP in monthly cycles and S&OE in weekly cycles. After the S&OP handover (P1), the S&OE plans are monitored (P2), adjusted (P3) and reviewed (P4) in the Advanced Planning & Scheduling (APS) zone. Here, demand and supply plans are continuously met with transactions (T1, T2, T3, T4) managed in the Enterprise Resource Planning (ERP), Warehouse Management System (WMS) and Transportation Management System (TMS) zones. The plans are eventually converted into customer, production, warehouse and distribution orders.
Download the full S&OE Subway Map
Fill in the form below and receive the S&OE Subway Map in your mailbox.
To read this subway map, start at the S&OP handover on the left and see where it takes you.
Find all Subway Maps of Supply Chain Movement >>
Download: S&OE Subway Map
Related posts:
-

Planning in the twilight
Numerous articles have been published recently on the topics of no-touch planning and lights-out planning. The first thought that comes…
-
S&OP Subway Map: A journey from strategy to schedule
Sales & Operations Planning and the more extensive Integrated Business Planning are both decision-making processes that aim to proactively balance…
-

Eight-tier planning system for fashion company Stichd
Fashion company Stichd has an extremely complex planning process. To help the company get a grip on its multi-dimensional supply…
-

eBook: The journey to world-class S&OP and S&OE
S&OP (Sales & Operations Planning) and S&OE (Sales & Operations Execution) processes help synchronise decision making across all this complexity…